
A Good-Looking Website Can Still Feel Slow
Polished design, strong copywriting and clear buttons count for very little if a page takes ages to appear. Visitors rarely wait around; they leave before they ever reach your contact form.
Speed is therefore a business concern as much as a technical one. A sluggish page delays the information people came for, breaks their momentum and quietly reduces enquiries.
We decided to stop trusting our own impressions. Pages feel quick on a fast office laptop and connection, which tells you little about a visitor on a mid-range phone. So we tested our site with Google PageSpeed Insights and Lighthouse, found out what was dragging it down, and checked how much our fixes changed.
The Lighthouse performance scores moved like this:
- Mobile: 50 to 90
- Desktop: 54 to 99
Below, we walk through how we worked, which technical areas deserve the most attention, and what other businesses can copy when they want to improve their website PageSpeed score.
1. Starting With a Baseline
No optimisation should begin until you know where you stand. We ran the site through Google PageSpeed Insights on both mobile and desktop. The tool pairs Lighthouse, which runs a controlled lab test, with data from real visitors whenever enough of it exists.
Our first Lighthouse run flagged several weak spots:
Metric | Starting value | What it told us |
Mobile performance | 50 | Plenty of room to improve |
Desktop performance | 54 | Even desktop was underperforming |
Largest Contentful Paint (LCP) | 9.5 s | Main content took far too long to appear in the mobile lab test |
First Contentful Paint (FCP) | 6.8 s | Visitors waited a long time to see anything |
Total Blocking Time (TBT) | 370 ms | Scripts were tying up the browser and slowing response |
Speed Index | 6.8 s | The page filled in visually at a slow pace |
Cumulative Layout Shift (CLS) | 0 | No layout movement in that particular run |
Numbers like these turn the vague statement that the site is slow into something you can act on. A high LCP often points to a heavy hero image, a late-loading headline or some other large element. A high TBT usually means JavaScript is hogging the browser’s main thread and holding back interaction.
Takeaway: The overall score tells you how big the problem is. The individual metrics and diagnostics tell you where to look.
2. The Metrics Worth Understanding
Before touching any code, it helps to know what each major metric actually captures.
Largest Contentful Paint (LCP)
LCP records the moment the biggest image or block of text in the visible area finishes rendering. It is the closest single number to how quickly a page feels loaded.
Google’s guideline is 2.5 seconds or better, judged at the 75th percentile of real visits.
Typical reasons for a poor LCP:
- A slow server response
- Large hero images that have not been optimised
- CSS and JavaScript that block rendering
- Key resources that the browser finds too late
- Web fonts that load inefficiently
First Contentful Paint (FCP)
FCP counts the time between starting navigation and the browser drawing its first piece of content, whether that is text, an image or an SVG.
If FCP is late, a page can look broken or frozen before anything useful shows up. A faster server, fewer render-blocking files and leaner critical CSS all help.
Total Blocking Time (TBT)
In Lighthouse lab tests, TBT adds up the time that long tasks keep the main thread busy between FCP and Time to Interactive.
Heavy JavaScript components, surplus third-party scripts and demanding browser-side work push it up. Trimming unused code, splitting bundles and deferring scripts that are not urgent are the usual remedies.
Remember that TBT is a lab measurement. It cannot replace Interaction to Next Paint (INP), which reflects how responsive the page feels to real people.
Cumulative Layout Shift (CLS)
CLS tracks how much the content jumps around while the page is open. A typical example is text being pushed down because an image without set dimensions has just loaded, or a banner appearing above what you were reading.
A score of 0.1 or lower is considered good. Setting image dimensions, reserving room for dynamic elements and handling fonts carefully all keep layouts steady.
Interaction to Next Paint (INP)
INP looks at how quickly the page reacts visually after users click, tap or type during a visit. Aim for 200 milliseconds or less.
TBT and INP both relate to responsiveness but are not the same thing. A page can post a healthy TBT in the lab and still feel laggy for real visitors.
3. How We Approached Website Speed Optimisation
Speed rarely comes from one magic setting. The server, page structure, images, stylesheets, scripts, fonts, caching and third-party services all interact, so we worked through each area in turn.
3.1 Picking a Lean Theme and Page Builder
Your theme and page builder decide how much HTML, CSS and JavaScript the browser has to handle. A striking layout can become bloated when it leans on heavy animations, deeply nested components, leftover scripts or several plugins doing the same job.
The aim is not a bare-bones design. It is getting the features you need without the extra weight.
What we reviewed:
- The code produced by the theme and page builder
- Widgets and components that serve no purpose
- Animations and effects that add little
- Plugins with overlapping features
- The speed impact of each design decision
Why it matters: A simpler page asks less of the browser, so it renders and responds sooner.
3.2 Hosting and Server Response
Nothing appears on screen until the browser has received the first files. That makes server response time a foundation for everything else, and a slow Time to First Byte (TTFB) pushes back both FCP and LCP.
On the server side we looked at:
- Whether the hosting resources and response times were adequate
- Server-level and full-page caching
- Database queries and back-end processing
- Redirects that were not needed
- Whether the server setup delivers files efficiently
The right fix depends on the hosting setup and on what is actually causing the delay. Moving to a bigger plan will not help much if oversized images or render-blocking files are the real culprits.
3.3 Images and the LCP Element
On most sites, images are the heaviest files, especially in hero banners and case studies. A picture that looks crisp on a large monitor may be far larger than a phone needs.
Image improvements include:
- Compressing files while keeping quality acceptable
- Using formats such as WebP or AVIF where suitable
- Serving different sizes for different screens
- Declaring width and height
- Replacing oversized source files
- Lazy loading images that sit below the fold
The LCP image deserves extra care. When it is the main image at the top of the page, it generally should not be lazy-loaded, and it can be given priority so the browser requests it early.
Be careful, though: preloading or prioritising everything makes assets compete for bandwidth. Base your choice on the LCP element your testing actually identifies.
Why it matters: Getting the main visual in front of users faster improves how quick the site feels and lowers LCP.
3.4 Cutting Render-Blocking CSS
CSS controls how a page looks, but the browser may hold off drawing anything until it has downloaded and processed the stylesheets.
Ways to reduce the delay:
- Stripping out CSS that is never used
- Shrinking overall stylesheet size
- Loading the styles needed for the first screen ahead of the rest
- Limiting how many stylesheets depend on one another
- Checking the CSS that themes, plugins and page builders add
Critical CSS lets the browser show essential content sooner while the remaining styles load without holding up the first view.
Test everything. Removing CSS carelessly can wreck layouts, responsive behaviour or interactive features.
3.5 Streamlining JavaScript
Before a page becomes fully usable, JavaScript can create a lot of work for the browser. Third-party scripts, animation libraries, tracking tags, sliders and interactive widgets all add to it.
We examined what each script does and looked for work we could cut:
- Dropping unused JavaScript
- Removing scripts loaded more than once
- Deferring scripts that can wait
- Loading asynchronously where it makes sense
- Splitting code so each page loads only what it needs
- Auditing third-party integrations
The goal is not to get rid of JavaScript. It is to let essential content appear quickly and keep non-essential processing from holding visitors up.
3.6 Better Font Delivery
Fonts influence both appearance and rendering. Several font families, unused weights or multiple external font files increase requests and can postpone text.
Improvements to consider:
- Loading only the families and weights the design actually uses
- Choosing efficient formats such as WOFF2
- Hosting fonts locally where it fits
- Setting a sensible font-display value
- Using resource hints sparingly for fonts that are critical
Test for layout shifts after any font change, because the fallback font and the final font can differ in character width and line height.
3.7 Compression and Caching
Text-based files such as HTML, CSS, JavaScript and SVG usually travel faster when compressed with GZIP or Brotli.
Caching cuts repeated effort. With proper browser caching, returning visitors do not need to re-download unchanged files, while server-side and full-page caching reduce the work needed to build a page each time it is requested.
Good caching depends on sensible policies, particularly for files that change often. A solid setup covers:
- Compression for eligible files
- Browser cache headers
- Versioning of static assets
- Server-side caching
- Full-page caching where it suits the site
- Clearing caches after website updates
Each of these tackles a different stage of delivery, so assess them together instead of treating them as interchangeable.
3.8 Fewer External Requests
Every outside dependency can add DNS lookups, connection setup, downloads and script execution. Analytics tags, embeds, chat widgets, external fonts and marketing tools are the usual suspects.
Keep the services your business really needs and remove the rest. In some cases, a preconnect hint helps the browser reach an important external origin sooner, but adding hints for every domain wastes effort instead of saving it.
3.9 Auditing Plugins and Components
Plugins extend what a site can do, yet unnecessary or badly configured ones can add scripts, stylesheets, database work and outside requests.
A proper review asks what each plugin does, whether the site truly needs it and whether it affects the front end.
Deleting a plugin is not automatically a win if it is not behind the bottleneck, and merging plugins or swapping them for custom code is not always better either. Focus on overhead you can measure, and make changes that speed things up without hurting security, functionality or maintainability.
4. Before and After: What the Tests Showed
Once the work was complete, we ran PageSpeed Insights again. Lighthouse scores had risen sharply on both device types.
Test | Before | After | Gain |
Mobile performance | 50 | 90 | +40 points |
Desktop performance | 54 | 99 | +45 points |
That is a 40-point rise on mobile and a 45-point rise on desktop. These are lab scores, and they show the tested page performing far better under the later test conditions.
Be aware that Lighthouse results shift with device emulation, network throttling, browser conditions and changes to the page. Treat them as readings from specific test runs, not as a promise that every visitor will see the same gain.
Other results in the later desktop report
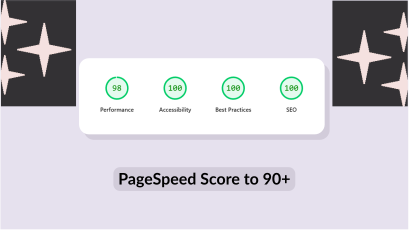
- Accessibility: 100
- Best Practices: 96
- SEO: 92
These are separate Lighthouse categories and add context. A top accessibility or SEO score does not mean a site meets every accessibility standard or has no SEO problems left.
5. Lab Data vs Real-User Data
One lesson stood out from this project: a Lighthouse score and real-user data answer different questions.
Lighthouse lab data comes from a controlled test. It is ideal for diagnosing bottlenecks, reproducing problems and confirming that a code change worked.
Core Web Vitals field data reflects what actual visitors experienced across devices over time. It shows how the site performs in everyday conditions.
The mobile field data in our earlier PageSpeed Insights report looked like this:
Field metric | Earlier report |
Largest Contentful Paint | 2.6 s |
Interaction to Next Paint | 135 ms |
Cumulative Layout Shift | 0 |
The earlier desktop field data showed an LCP of 2.6 seconds, an INP of 45 ms and a CLS of 0.03.
So what real visitors experienced differed from the first mobile lab test. That is normal, since field data covers many kinds of visits, devices and connections.
It also means we cannot say field LCP improved from 9.5 seconds to something lower unless a later field report confirms it.
Google assesses Core Web Vitals at the 75th percentile of visits, separately for mobile and desktop, and a page generally passes when all three metrics meet their thresholds.
For a trustworthy picture you need both: lab tests to diagnose and validate, and field data to see what visitors actually get.
6. Five Lessons Any Business Can Use
Speed work is not only for developers. Any company that depends on its website to attract visitors, show expertise or win enquiries has a stake in it.
Measure before you guess. A page that feels instant on an office machine may crawl on a phone over a weak network. Record baseline results and study the diagnostics before changing anything.
Tackle the biggest problems first. Recommendations are not equal. A very slow LCP deserves attention before small code minification, and a long server response may need fixing before more image compression. Rank issues by likely impact, effort and risk.
Put mobile first. Mobile visitors face weaker hardware, patchier networks and smaller screens. Test mobile and desktop separately, and watch heavy images, script execution and anything that delays the first render.
Do not break things while optimising. A fast page is worthless if navigation fails, forms stop submitting or tracking vanishes. After every meaningful change, check key templates, devices and user journeys.
Keep monitoring. Speed can slip after a redesign, plugin update, new integration or fresh content. Retest after major releases, follow trends and investigate regressions instead of relying on one good score.
7. Our Ongoing Approach to Performance
For Black Cap IT, the point was never just a prettier number in a testing tool. We wanted a measurable, repeatable way of managing performance. Our cycle looks like this:
- Measure: Set a baseline using PageSpeed Insights and Lighthouse.
- Diagnose: Study the metrics, page resources and bottlenecks behind the score.
- Prioritise: Pick the changes likely to deliver the biggest gain.
- Implement: Make targeted changes while keeping required functionality intact.
- Validate: Run comparable tests and check key user journeys.
- Monitor: Review field data and retest after significant changes.
Performance is never a one-off project. It is a permanent part of looking after a website properly.
Conclusion: Speed Is an Engineering Habit, Not a One-Time Fix
Raising our Lighthouse performance score from 50 to 90 on mobile and from 54 to 99 on desktop shows what measuring carefully and fixing methodically can achieve.
Website speed does not hinge on a single setting. It comes from server response, page structure, image delivery, CSS, JavaScript, caching and the way the browser renders, all working together.
The starting point for any business is simple: measure the experience today, find the biggest bottlenecks, make focused improvements and confirm the results.
A high Lighthouse score is useful evidence, but lasting performance takes continued attention to real-user experience, working functionality and the technical decisions behind every update.
Does your website give visitors the experience they expect?
Black Cap IT works with businesses and digital agencies on website development, optimisation, maintenance and technical improvements that protect long-term quality. Talk to our team about your website’s performance and development needs.
Need WordPress Development Capacity?
Frequently Asked Questions
How can I improve my website's PageSpeed score?
Begin by running Google PageSpeed Insights to find the bottlenecks. Look at LCP, FCP, TBT, CLS and the listed diagnostics. Depending on what you find, the fix may involve compressing images, removing render-blocking resources, speeding up the server, trimming JavaScript or setting up proper caching.
What counts as a good PageSpeed Insights performance score?
Lighthouse rates 90 to 100 as good, 50 to 89 as needing improvement and 0 to 49 as poor. The score is a lab measurement, so read it alongside Core Web Vitals field data.
Does website speed affect SEO?
Page experience, including Core Web Vitals, feeds into Google’s wider ranking systems. Fast pages do not guarantee top rankings, though. Relevant content, crawlability, site structure, authority and search intent all still matter.
What are Core Web Vitals?
They are metrics that assess loading speed, responsiveness and visual stability. The current set is Largest Contentful Paint (LCP), Interaction to Next Paint (INP) and Cumulative Layout Shift (CLS).
Is a PageSpeed score of 99 better than 90?
Both sit in the Lighthouse’s good range. 99 is higher in the lab test, but the real-world difference depends on the underlying metrics and what visitors experience. Never sacrifice usability or essential features just to chase a perfect score.
How often should I test my website's speed?
Test after major design changes, plugin or dependency updates, new integrations and significant content changes. Regular monitoring also helps you catch regressions before they settle in.